
Expertise
- Web Application Development
- User Experience Design
Client:
RW Pierce
Industry
Demystifying data analytics for financial institutions
Logic+Magic have developed an innovative analytics tool for our client RW Pierce, to be used by their customer credit unions, giving them access to powerful online reporting. It aims to provide key insights into business performance and customer demographics.
The strategy
RW Pierce asked us to undertake a UX exercise to reimagine their existing reporting tool prototype with a new product interface and assess its viability as a commercial SaaS application.
The requirement was to provide users with a simple interface where they could easily explore complex data and have demographics visualised in intuitive ways.
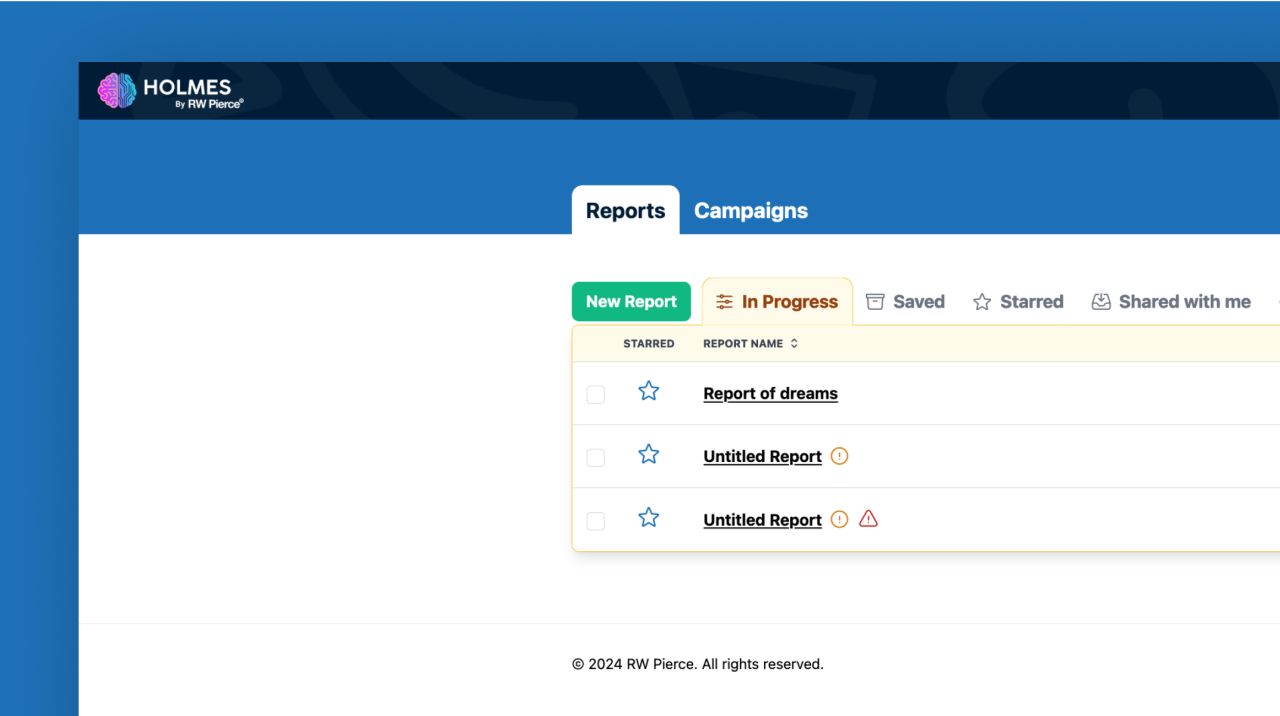
With teams of people collaborating using the platform, the reports needed to have the ability to be saved and amended. They also needed to be sharable within their respective organisations, whilst still maintaining data security.
From a technical standpoint, one of the primary challenges was how we would get the vast amounts of raw data RW Pierce already had in to the new application in a quick, reliable and secure way.
Related to that, we would need to query all that data in a performant way.


The solution: the application
Following an in-depth UX phase, our team of developers then took the reins to build the application.
We utilised a tech stack of Ruby on Rails, PostgreSQL, and JavaScript. We opted to host it using the Heroku platform, which provides many advantages with integration into useful third-party services making development more streamlined.
Due to the ever-changing underlying raw data our application would need to process - the first action was to tackle the date import process.
We designed and built a bespoke, automated and versioned toolset that allowed the client to schedule data imports. The raw data is prepared and uploaded securely to the cloud. Our automated importer is then triggered and processes the data, providing real-time feedback on the progress.
The solution: data
Each dataset is many gigabytes in size, so once the new data version is ready, the client can sanity-check it by previewing it (against all organisation customers).
When they are satisfied the process has succeeded, and the new data is correct, they can then publish the new version making it available immediately to all customers. Rolling back to previous versions is also available at any time.
With the data imported, processed and stored, we then had to work out a way of presenting it effectively in the report. The requirement was always to allow the end user to generate a new report and define what they wanted to see in it, aligning with their own reporting objectives.
The impact
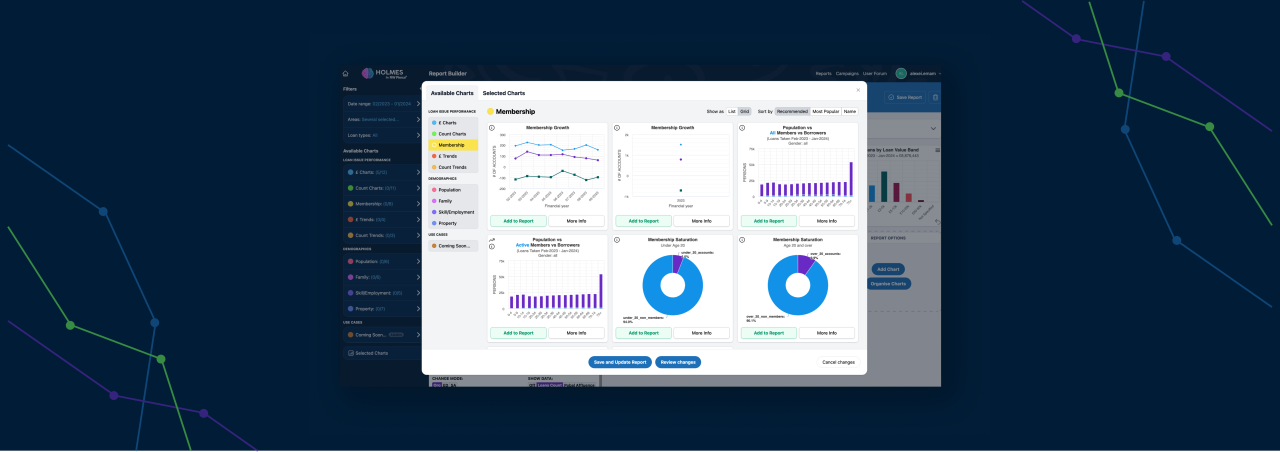
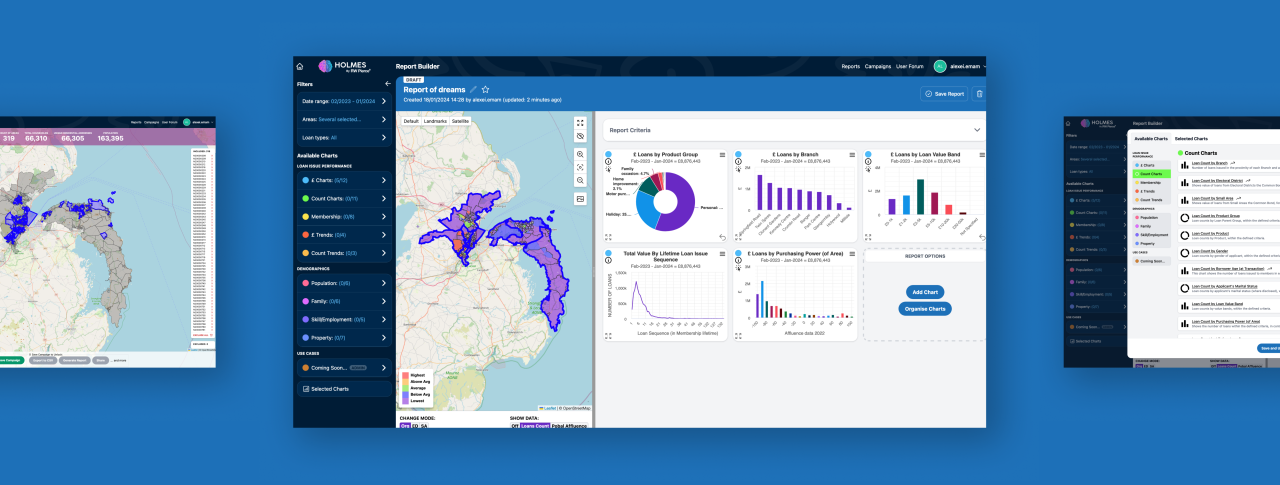
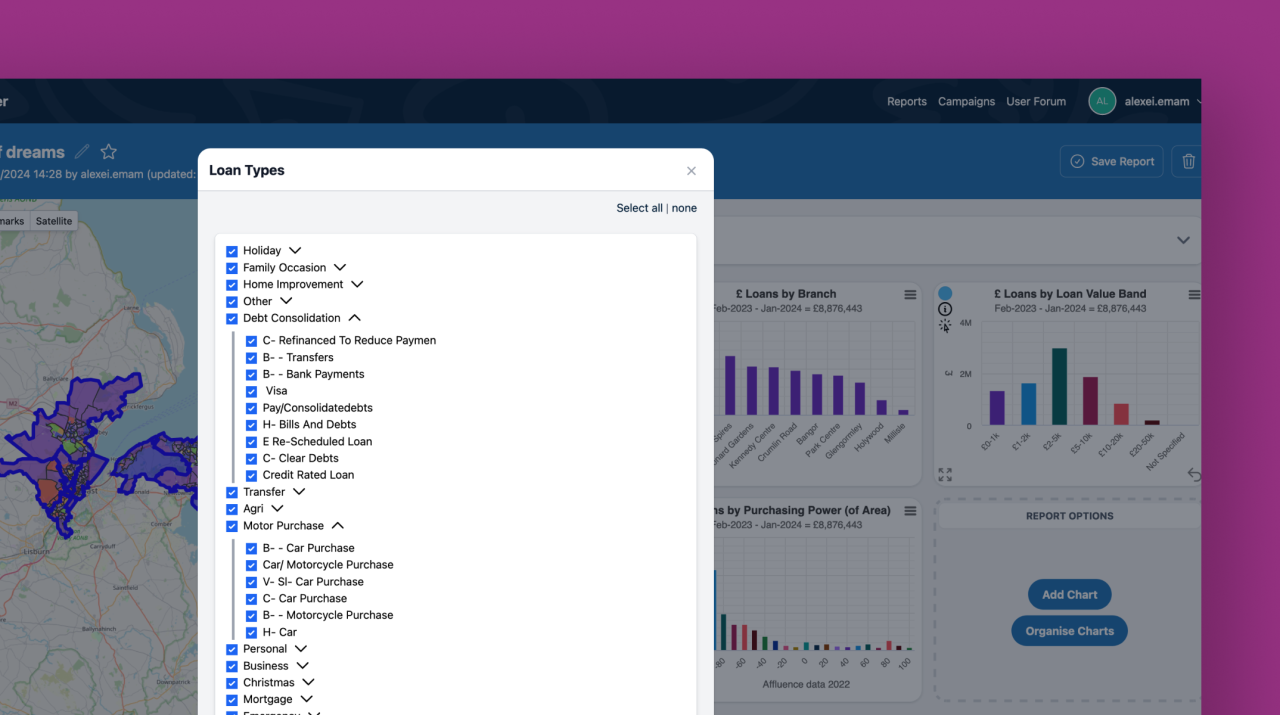
Along with the UX team we developed an intuitive report builder where the user can filter the entire dataset based on key areas and population demographics. Users filter the data and choose the charts they want to include in their report.
Another technical challenge was how to query the data based on the user’s criteria. Due to the significant nature of the data, doing this in a performant way took some figuring out.
Alongside interactive charts and maps, the report provides an insight into end-customer behaviour, and business performance which can then be used for finding interesting trends and targeting new end-customers.